Quick Links
The crypto industry is rapidly progressing, and projects offering new solutions are taking the Web3 revolution forward. Launchpads are a very important pillar in the Web3 ecosystem as they play a crucial role for the introduction of these projects to the market and help these projects onboard early contributors who believe in the project and raise funds.
In this blog, we examine the Public Sale and Launchpads performance between January to May 2024. In the pursuit to understand the sector’s dynamics, we have done an extensive study of 142 projects and tried to peel out different metrics such as ROI, average ROI, ATH ROI, funds raised, to gather insights on the state of the sector.
Key Metrics Analyzed
- ROI (Return on Investment): This metric measures the returns generated on investments. Basically, it helps us understand the token performance after launch.
- Average ROI: Calculated as the mean ROI of all IEOs, providing a benchmark for performance comparison.
- ATH ROI (All-Time High ROI): This metric indicates the highest ROI ever achieved by a token since launch.
- Funds Raised: The total capital raised by a project from the public sale.
- Risk: The volatility or risk associated with the returns.
- Hope you will enjoy the read, let’s head dive in.
Insights and Analysis
Negative Returns
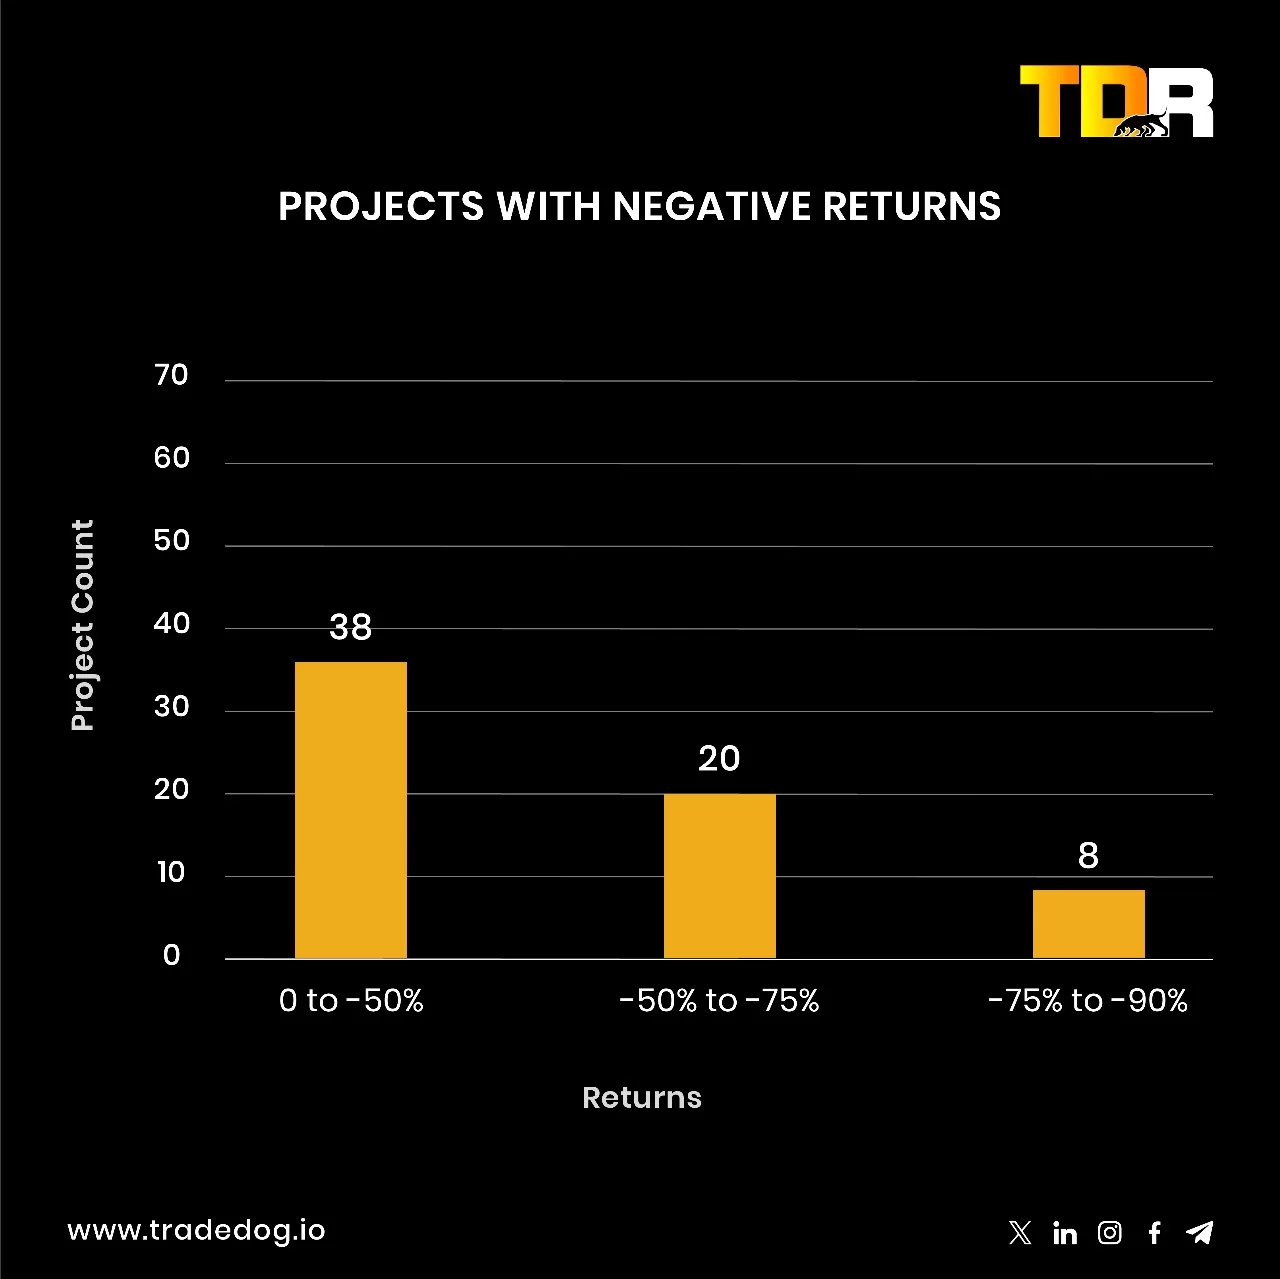
A significant portion of public sales did not perform well, with 66 projects (46% of public sales done during the period) delivering negative returns. This clearly indicates the importance of due diligence and this is where a platform like TDX offers access to highly vetted projects so as to safeguard the investors’ interests. Here is the detailed breakdown of the same-
- 38 projects (27% of public sales during the period) had negative returns of 50% or more, reflecting a considerable loss for investors
- 20 projects (14% of public sales during the period) had negative returns of 75% or more, which is particularly concerning for investors looking for safe bets
- 8 projects (5% of public sales during the period) had negative returns of 90% or more, highlighting the extreme risks involved in some investments

Average and Extreme Returns
The average return generated by public sale of tokens during this period was 142%, indicating significant profitability for many investors. This metric shows that, on average, investors more than doubled their investment. The minimum return observed was -80% in case of Reebot World and Vinci Protocol whose price crashed below the public sale price highlighting the potential for significant losses in the crypto market. The maximum return reached an impressive 5160% by Donato Creator Token , demonstrating the potential for extraordinary gains. This high ROI is a major attraction for investors looking to capitalize on new projects.
The average ATH return generated by IEOs during this period was 702%, indicating high profitability from the issue price. This means that an impressive return of 7x could be grabbed if any investor would have exited at the top.
The above graph gives us information about the average return concentration of the projects.It highlights the number of projects that have given returns in the range specified in the graph. For instance, 37 projects have generated an avg. return in the range of 0% to 100%.
The above graph highlights the number of projects which have generated average ATH return in the range specified in the graph. Few projects have a negative avg. ATH return as these tokens listing price on exchange were less than the public sale price and never reached its public sale price after the token started trading on exchange.
Token Performance and Fund Raised
As we delved deeper, our analysis revealed some interesting insights-
i) 35 projects have ROIs greater than the average ROI (142%)
ii) 86% of these 35 projects have raised funds less than $1.5M (the average funds raised in the duration Jan – May 2024)
This suggests that the smaller projects where rightly valued hence after listing they were able to generate higher return than average returns. To check the valuation we usually consider the TVL/ Market Cap ratio. If TVL is smaller than the Market Cap, the project is assumed to be overvalued and vice versa. Another approach to analyse is to evaluate the market demand and supply, projects which have raised less funds are usually less liquid and hence more volatile which results in the high pattern of return from these projects.
The above gives us information about the number of projects that raised funds in the range of a few hundred dollars to millions of dollars from January to May 2024. For instance, 28 projects have raised funds in the range of $1 Mn to $2.5 Mn.
Launchpad Analysis
Dominant Launchpads
Gate.io Startup launched a whooping 128 projects, and accounted for ~ 90% of public launches during the period. This dominance reflects preference among new projects which is primarily influenced by its centralized exchange which makes the overall value proposition highly significant for early stage projects..
Bybit facilitated 15 launches, around 11% of the total. Their growing presence indicates its increasing influence and their highly vetted project deals have helped them to become one of the top choices among Founders for token launches. The third name in the list of top launchpads is APE Terminal, and it was involved in 12 token launches, ~ 8% of the total.
One thing to note here is that big ticket raises of $5 million or more have chosen either Coinlist or Fjord Foundry as their Launchpads. This suggests that these platforms have been able to garner significant investor trust on the deals listed which has helped them in building an active community of investors.
Below is the list of top 10 Launchpads based on the number of token projects launched and fundraised through them during the period Jan – May 2024.
Launchpad Concentration
- 37% of the IEOs chose to launch their token on a single Launchpad.
- 63% of IEOs chose to launch their token on two launchpads.
- 42% of IEOs were launched on three launchpads, further showing the reliance on a limited number of platforms.
- 27% of IEOs were launched on four launchpads, and 17% on five launchpads, highlighting that while diversification among launchpads exists, it’s not the norm.
In general, projects have preferred launching on more than one launchpad to improve their chances of success. This strategy helps in reaching a broader audience and increasing the project’s visibility.
As per our findings, projects utilizing multiple launchpads saw a rise in both visibility and investor trust. This strategy may be worth exploring for new projects that seek increased visibility and improved investment results.
Launchpad Returns
Launchpads have generated significant returns for their investor in the first five months of 2024 and below is the chart that shows the average return in “x” times generated by the Top Launchpads.
On an average the top 10 launchpad return is 1.5 times with the highest average return of 2.17x generated by APE Terminal and lowest of 0.53x generated by Fjord Foundry.
Investor Considerations
Potential investors should diversify their portfolios and take into account the reputation and past performance of the launchpads due to the high risk associated with these investments. A careful investment strategy is needed when considering investing in public token sales due to their high volatility and chances of mid to heavy negative returns. Investors are highly recommended to do their own research before investing in any early-stage project in these launchpads.


