Quick Links
Crypto traders use different technical indicators when analyzing a specific cryptocurrency of their interest. While there are hundreds of different options to choose from, traders must zero in on those indicators that work best for them. Advanced traders may sometimes combine several technical indicators with more subjective technical analysis such as analyzing charts as mentioned here to get trade ideas. These technical indicators are also coupled with automatic trading systems to bear fruitful results whilst trading.
We will help you make sense of these technical indicators that will enable you to come up with different trade ideas and strategies. It will benefit you to trade safely without having to lose much in case something goes wrong. You can read about trading psychology here which is very important when using these indicators and charts. Using indicators and charts in crypto trading is a prerequisite to proper trades. We suggest you give a thorough read to understand how your headspace will be too important in the midst of an active trade.
What is Crypto Technical Analysis?
Technical analysis or simply TA is an enhanced analysis of the statistical trends of a cryptocurrency that is gathered from trading figures such as price and volume. It is done through reading and analyzing patterns such as price, candlesticks, doji, and other key indicators to spot trading opportunities and devise favorable trading strategies.
Crypto technical analysis is based on indicative measures to help assess market swings, sentiment, volumes, trends, and more. In other words, it helps you in determining the motivations of all other traders in a given market of a specific asset.
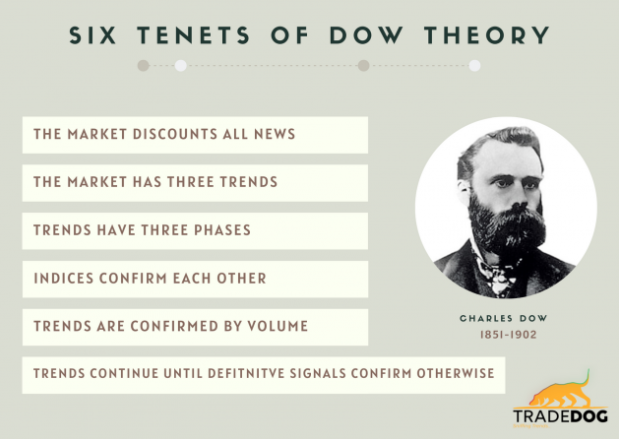
There are three types of movements in an asset’s market as devised by Charles Henry Dow, an American journalist. He is also revered as the father of technical analysis.
What are technical indicators?
Indicators are tools that when used by crypto technical analysis help traders predict price movements of securities. These are fairly sophisticated tools for following trends and monitoring market movement and if mastered, they can help you wager on a certain trend to bring back positive returns. Since a security’s price has momentum, it is imperative that you
These indicators are based on Newtonian physics which deals with reading the movement of macroscopic objects. They are used to monitor the movement of security over time to predict the near future which is why they are used predominantly.
In layman’s terms, indicators are just graphs and formulas to understand what are traders buying and selling & where market sentiment lie and is likely to linger in the future. Let’s find out how we can use technical indicators to develop different trading strategies.
Types of Indicators dominantly used by crypto-traders
Relative Strength Index (RSI)
RSI is a method to map an asset as to whether it is overbought or oversold. Ranging between 0–100, the RSI indicates over 70 represents that the asset is oversold and if it falls below 30, it is indicative that the markets are overbought. Numbers above 70 tell us that the markets can fall, whereas, numbers below 30 indicate that markets are likely to rise, thus, an easy indicator for beginners to start betting.
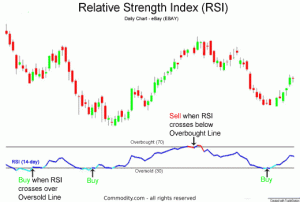
The numbers can help you out in two ways:
A number above 70 can help you with a selling opportunity
Number below 30 give you a possible buying opportunity
The RSI is the simple most beneficial tool for traders who usually map it for 14 days or more. It will not only help you determine market moments but allow you to buy or sell just on time.
Simple Moving Averages (SMA)
These are referred to as ‘simple signals’ and are widely used by crypto traders. SMAs are calculated by adding the prices over a given number of periods, then dividing the sum by the number of periods. Traders can make better trades by watching the downtrends and uptrends the best of what this Indicator tool does. By reading SMAs, you will be able to find support and resistance for prices and good buying points on pullbacks. It helps users to track new trends and opportune windows to place your trade and walk out with a good profit. Refer to this video by Datadash where they explain SMAs on the screen.
Momentum
This indicator allows traders to gauge the strength of price movements by comparing closing prices over time. The indicator is represented by a single line on the chart that helps traders realize how fast the price of an asset is moving. If the reading is higher than 100, it indicates that the price is rising and if the number falls below 100, the price is falling to the downside.
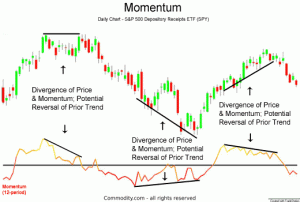
This tool is highly useful when identifying trends that are gaining or losing momentum. It allows traders to compare the most recent closing price to a previous closing price.
Volume
Volume is perhaps the most used and trusted indicator in the cryptocurrency sphere. It remains underrated due to traders relying on other indicators as their primary mode of market monitoring. The volume tool shows how many people are buying or selling a certain coin in a given timeframe. One of the fundamental factors before trading or investing lies in the understanding of the market volume of a cryptocurrency. Volume check is necessary even before thinking to choose any other analysis tool to be sure you’re not going to throw in the towel a little later when you lose your invested funds. This momentum can be equated to the classical formula i.e momentum=mass*velocity wherein the ‘mass’ represents the number of traders trading an asset. The fewer the traders, the lesser the momentum and conversely the opposite.
Moving Averages
Moving averages is a fine line on a crypto trading chart that represents the closing price of a crypto asset. The moving indicator calculates the average price of an asset over time while recalculating as the time moves forward. These are the most used indicators when venturing into the depths of crypto trading. They can also be used by beginners who struggle to wager on a trade’s success. You got to stick to just one crypto trading style and stick to it for an errorless pursuit of crypto profits.
Using the Moving Average is simple as you can modify how many periods you want to consider. You need to dictate the timeframe of the period you want to analyze before using this tool as it will work in sync with your trading style. If you are a short-term trader, a relatively shorter moving average will be beneficial for you. But if you’re a long-term trader, moving averages can extend to further periods. There are basically two types of moving averages namely, the traditional moving average and the exponential moving average which is a prominent tool to weigh the cryptocurrency’s recent prices.
Conclusion
By using these indicators, you will be confident enough to initiate trades even if you are a beginner. If you learn to interpret them correctly, you can utilize other trading styles and strategies to build value in your trading and investing. You can go from novice to an expert in a matter of days if you start with significantly low capital to assess your trading styles and these tools without losing much of your investment. The aforementioned tools, however, have some limitations in their own unique ways but they are a gateway to successful trading if interpreted correctly.

