Quick Links
Welcome to the dynamic realm of crypto trading! Be it your expertise or inexperience, the vast potential and volatility of the crypto market are well known to you. With countless coins and tokens accessible, navigating and making educated decisions can be overwhelming. But fear not, as we’ll discuss the ten best indicators for crypto trading and analysis in 2023 in this article to help maximize gains and minimize risks.
Technical indicators are an indispensable tool for any trader, assisting in analyzing past and present price trends and predicting future movements. These indicators are mathematical computations based on price and/or volume data and can provide valuable insights into market sentiment, momentum, and trend intensity. Moving averages, relative strength index (RSI), stochastic oscillator, and MACD (moving average convergence divergence) are some of the most popular indicators utilized in crypto trading.
In today’s fast-paced and ever-changing crypto market, having a firm comprehension of these technical indicators is crucial to making informed trading decisions. By interpreting these indicators and analyzing charts, traders can recognize key entry and exit points, establish stop-loss orders, and manage risk more effectively. This can eventually result in greater profits and a more successful trading strategy.
So, if you aspire to take your crypto trading to the next level in 2023, discover the ten best indicators for maximizing gains and minimizing risks in this exciting and rapidly progressing market.
Relative Strength Index (RSI)
Are you looking to enhance your comprehension of the Relative Strength Index (RSI) and its application in cryptocurrency trading? Look no further! We will explore what RSI is, how it’s utilized in the crypto market, and its advantages and disadvantages.
RSI is a technical indicator that gauges the variability of price fluctuations and is expressed on a scale ranging from 0 to 100. This momentum oscillator is calculated by comparing an asset’s average gains and losses. The RSI is deemed overbought when it’s above 70 and oversold when it’s below 30. Traders employ the RSI to spot potential entry and exit points in the market.
In cryptocurrency trading, RSI is a potent tool that traders use to identify market trends and momentum shifts. By discerning when a coin or token is overbought or oversold, traders can make more prudent trading decisions that maximize gains and minimize risks.
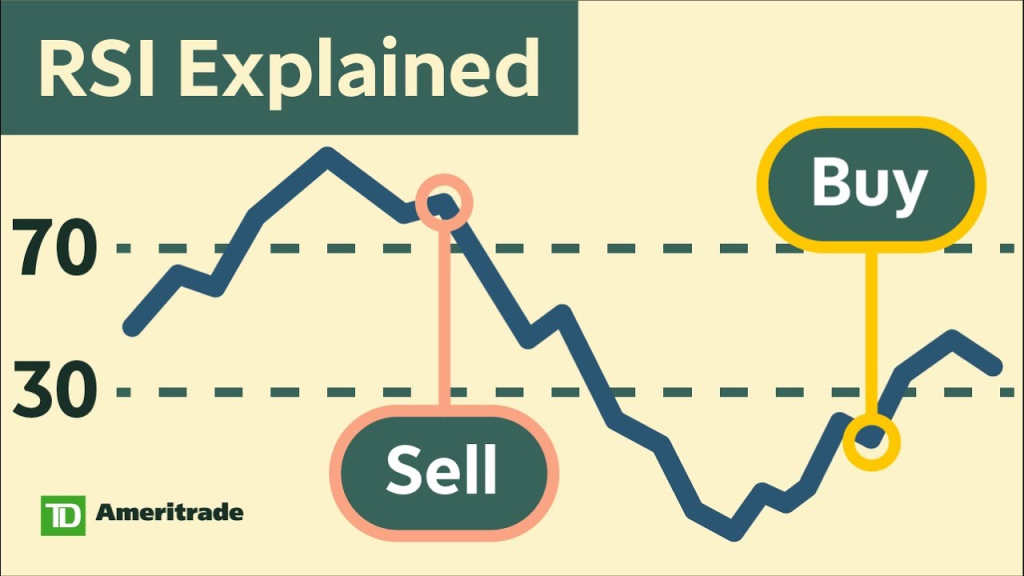
Nevertheless, it’s crucial to remember that no trading indicator is flawless. The RSI has its limitations and disadvantages, including being a lagging indicator that cannot predict future price movements. Additionally, RSI signals can sometimes be misleading in particular market conditions, such as during a robust trend or an abrupt price spike.
Thus, the Relative Strength Index is a valuable tool that traders can use to navigate the dynamic and unpredictable world of cryptocurrency trading. By comprehensively understanding how to use the RSI and its potential drawbacks, traders can gain an advantage and make more informed decisions in this stimulating market.
Moving Average Convergence Divergence (MACD)
The MACD is a technical analysis tool that gauges the correlation between two moving averages of an asset’s price. The formula for the MACD involves subtracting the 26-period exponential moving average (EMA) from the 12-period EMA, resulting in the MACD line. The chart also includes the signal line, a 9-period EMA of the MACD line. The MACD’s primary function is to determine the trend’s direction, momentum, and potential trend reversals.
In the world of cryptocurrency trading, the MACD is a popular device for recognizing trends and shifts in momentum in the market. Traders frequently search for bullish or bearish crossovers between the MACD line and the signal line and disparities between the MACD and the asset’s price to make educated trading choices.
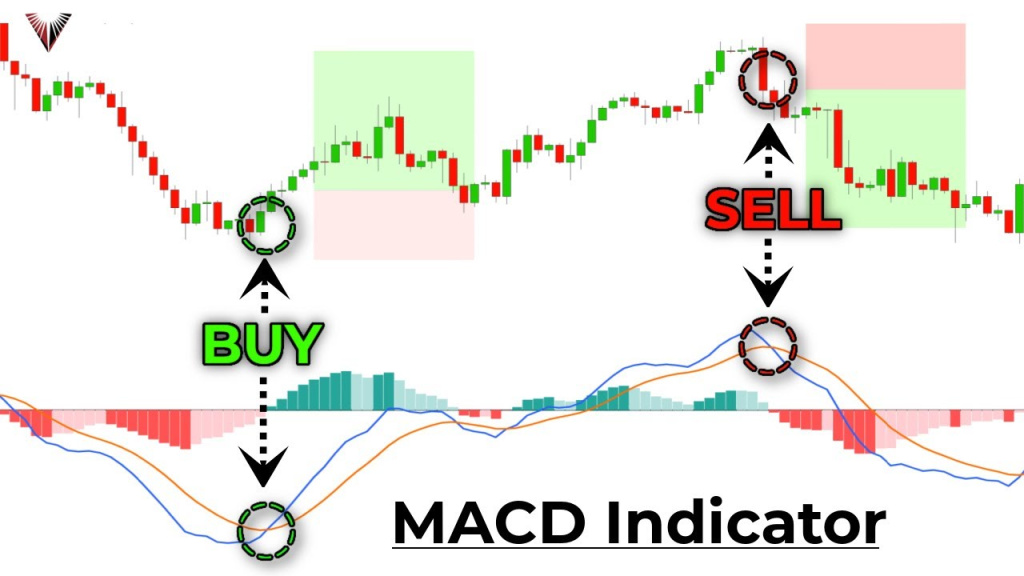
Although the MACD is a helpful indicator, it’s essential to recognize its drawbacks and limitations. For instance, like most technical indicators, the MACD may produce false signals, leading to losses if acted upon. Furthermore, the MACD is a lagging indicator, which implies that it can’t predict future price movements with complete accuracy.
Bollinger Bands
Are you considering trading cryptocurrencies and wondering how you can gain an advantage? Then you can take a closer look at Bollinger Bands. This technical analysis indicator combines moving averages and standard deviations to help traders determine entry and exit points in the market.
The Bollinger Bands are composed of three lines: a middle band, a simple moving average, and two outer bands based on the SMA and a specific number of standard deviations. The bands expand or contract in relation to the market’s volatility. This expansion and contraction can help traders to identify the overbought or oversold conditions. If the price hits the upper band, it may indicate that the asset is overbought and signal a sell, whereas if it touches the lower band, it may indicate that the asset is oversold and signal a buy.
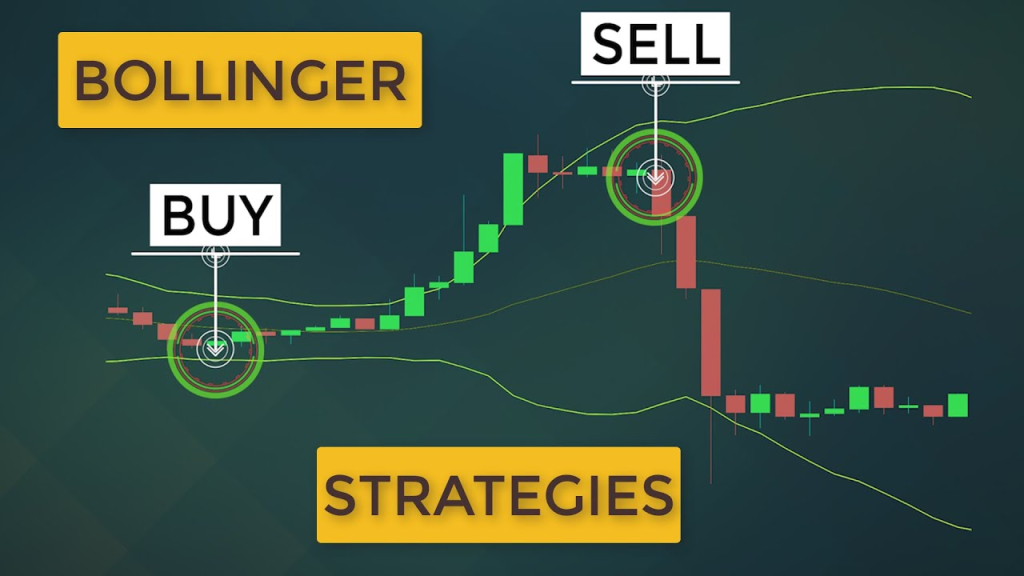
Bollinger Bands are widely used in cryptocurrency trading due to their volatile nature. They can assist traders in identifying trends and potential price reversals, which is crucial for informed trading decisions. However, it’s important to note that there are also certain disadvantages. For instance, the bands can be unreliable in choppy markets, where prices fluctuate within a tight range. Additionally, no indicator can guarantee complete accuracy in predicting future price movements, so using Bollinger Bands alone can be risky.
In conclusion, Bollinger Bands can be a powerful tool for cryptocurrency traders, but they should be combined with other indicators and analysis methods. By understanding the limitations of Bollinger Bands and how they function, traders can gain a competitive edge and make more informed decisions.
Ichimoku Cloud
Attention all crypto traders looking to improve their skills! Have you heard of the Ichimoku Cloud? If not, it’s a technical analysis tool developed in Japan in the mid-20th century and consists of various components, such as a cloud, baseline, and conversion line. Together, these components can help you identify potential market trends and reversals.
One significant advantage of the Ichimoku Cloud is its ability to provide multiple layers of support and resistance levels. The cloud is formed by two lines, Senkou Span A and Senkou Span B, and the space between them can indicate the market’s trend and potential buy and sell zones.
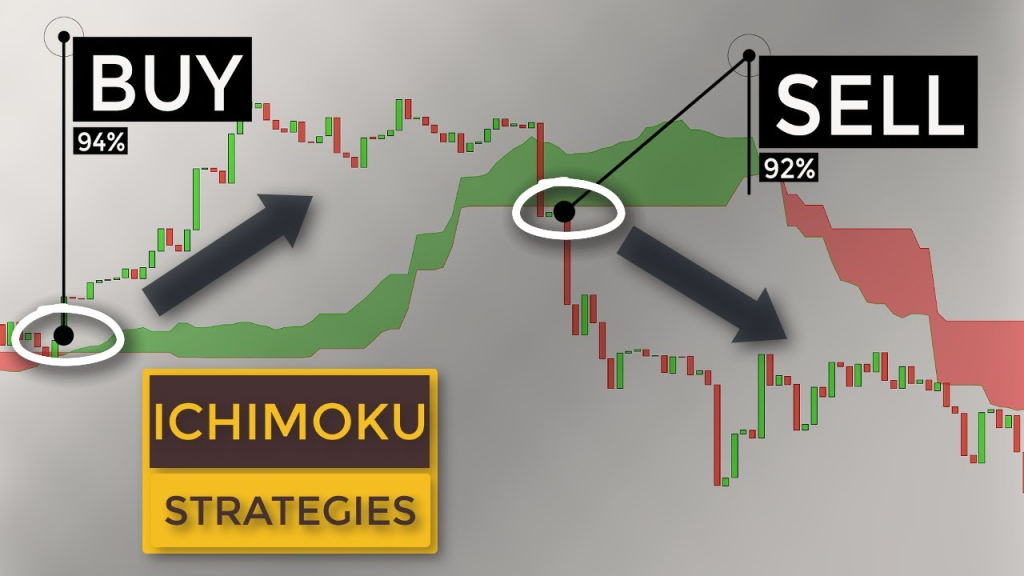
The Ichimoku Cloud benefits cryptocurrency trading due to the market’s fast pace and volatility. With its various components, you can spot entry and exit points and measure trend strength.
However, knowing that the Ichimoku Cloud can be overwhelming and complex for new traders is essential. Additionally, it may not work well in range-bound or choppy markets.
On Balance Volume
On Balance Volume (OBV) may be worth exploring if you want to improve your cryptocurrency trading skills. This technical analysis tool helps identify potential trends and price movements in the market.
OBV is a momentum indicator that tracks buying and selling pressure based on trading volume. It does this by adding volume on up days and subtracting volume on down days. Traders can use the resulting OBV line to determine whether buying or selling pressure dominates the market.
In cryptocurrency trading, OBV can be particularly useful due to the volatility that often stems from changes in trading volume. By using OBV, traders can better identify potential entry and exit points based on price and volume shifts.
OBV helps traders spot trend reversals before they occur. If the OBV line moves in the opposite direction of the price, it may signal a potential reversal in the trend. Additionally, OBV is also used to confirm the strength of a trend by comparing the direction of the OBV line with the direction of the price.

However, its limitation is that it may not be less effective in low-volume markets since volume is a crucial component of its calculation.
Stochastic Oscillator,
The Stochastic Oscillator, measures the current price of a cryptocurrency relative to its price range over a defined period. This momentum indicator helps traders determine if an asset is oversold or overbought, indicating potential trend reversals.
For cryptocurrency trading, the Stochastic Oscillator is particularly useful in volatile markets, identifying possible entry and exit points based on changes in momentum. Traders can interpret the Stochastic Oscillator line and its moving averages to understand current market sentiment better and make more informed trading decisions.

A key advantage of the Stochastic Oscillator is its versatility. It is easy to understand and can be deployed in any time frame, making it an excellent choice for novice and experienced traders alike.
However, traders must note that the Stochastic Oscillator can generate false signals in markets with low volatility, potentially leading to costly trading decisions.
Average True Range (ATR)
ATR is a volatility indicator that measures the range of price movement of a cryptocurrency over a specified period. Unlike other indicators, the ATR considers gaps in price action, making it a more precise reflection of a cryptocurrency’s volatility.
The ATR is particularly useful in determining stop-loss levels and setting price targets in cryptocurrency trading. ATR equips traders to gauge the cryptocurrency’s volatility and adjust their trading strategy accordingly. For instance, a cryptocurrency with a high ATR value may be more suitable for short-term trading, whereas a low ATR value may be better suited for long-term trading.
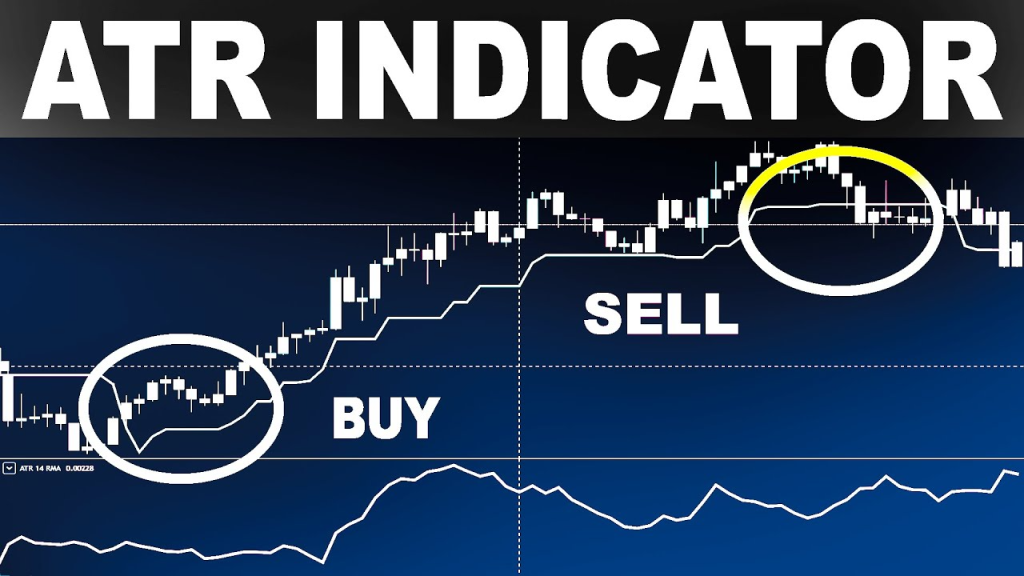
ATR provides a more accurate depiction of a cryptocurrency’s volatility. This makes it a valuable tool for traders seeking to manage risk and optimize their trading strategy. Furthermore, the ATR is user-friendly and can be applied to any time frame, making it a versatile tool for traders of all levels.
However, there are some disadvantages to using the ATR. For example, the ATR doesn’t provide information about the direction of price movement, which can restrict its usefulness in certain market conditions.
Fibonacci Retracement,
The Fibonacci Retracement, is used to identify the possible levels of support and resistance in a cryptocurrency’s price movement. This tool is based on the Fibonacci sequence, a mathematical sequence that results from each number being the sum of the two preceding numbers.
The Fibonacci Retracement is a handy tool to plan entry and exit in a trend. By applying the Fibonacci levels to a chart of a cryptocurrency’s price movement, traders can spot levels at which the price may come across support or resistance. This can enable traders to make more sound decisions regarding their entry or exit times for trade. This assists traders in managing their risk and enhancing their trading strategy.
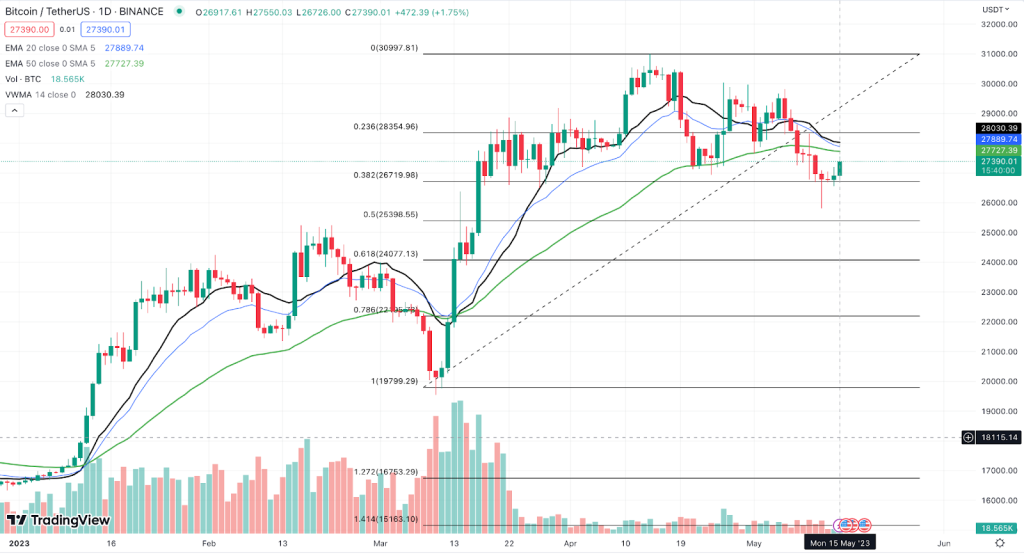
The Fibonacci Retracement tool also has some limitations. For instance, the levels the tool identifies may only sometimes remain effective in practice, as the conditions in the market can be unpredictable.
Williams %R
Williams %R is a technical analysis oscillator that measures overbought and oversold levels in a cryptocurrency’s price movement. It was developed by Larry Williams and is calculated by comparing the current closing price to the high and low prices of the previous n periods, usually 14.
In cryptocurrency trading, Williams %R is used to identify a trend’s potential entry and exit points. When the indicator reaches oversold levels (below -80), traders may consider buying, as the price may be due for a bounce. Conversely, traders may consider selling when the indicator reaches overbought levels (above -20), as the price may be due for a correction.
Williams %R allows traders to quickly identify potential overbought and oversold conditions in a cryptocurrency’s price movement. This helps them make more informed decisions about when to enter or exit a trade. The indicator is also easy to use and understand, making it accessible to traders of all skill levels.
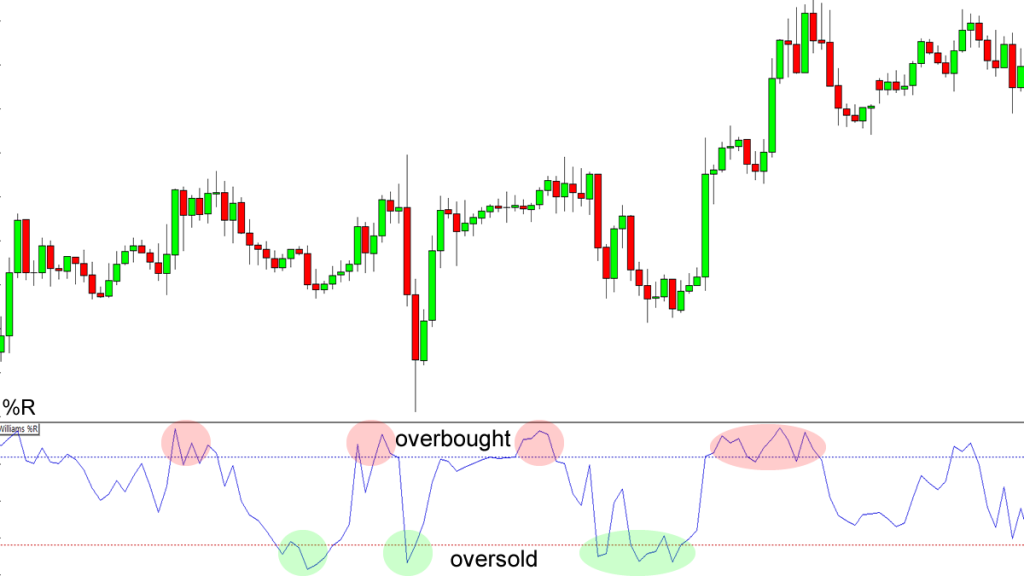
However, using Williams %R has some disadvantages. For instance, the indicator may provide false signals in choppy or sideways markets.
Volume Weighted Average Price (VWAP)
VWAP is a tool used for technical analysis that calculates the average price of a cryptocurrency based on its trading volume. Unlike other averages, VWAP emphasizes price movements with higher trading volumes.
VWAP is commonly used as a benchmark to compare the current price of a cryptocurrency against its average trading price. If the current price is below VWAP, it may mean that the cryptocurrency is undervalued. Conversely, if the current price is above the VWAP, traders may consider selling, as it may indicate that the cryptocurrency is overvalued.
VWAP gives traders a more precise picture of a cryptocurrency’s value, considering both price and trading volume. This comes in handy to identify entry or exit. Moreover, the indicator is customizable, allowing traders to adjust the time frame and number of periods used in the calculation to fit their trading strategies.

However, using VWAP also has some disadvantages. For example, the indicator may need to catch up to sudden market movements or account for significant news events that impact the market. Additionally, there may be more suitable indicators for short-term trading strategies than VWAP, as it provides a longer-term view of a cryptocurrency’s value.
Conclusion
In crypto trading, possessing the appropriate array of tools and indicators is crucial for maximizing profits and minimizing risks. As explored in this article, the top 10 indicators for crypto trading and analysis in 2023 offer invaluable insights and guidance to traders navigating the volatile crypto markets.
Our first contender is the Relative Strength Index (RSI), a tool that aids traders in evaluating the strength of a cryptocurrency’s price movement. The RSI provides valuable indications of overbought or oversold conditions by comparing recent gains and losses.
Following suit is the Moving Average Convergence Divergence (MACD), which amalgamates moving averages to detect potential trend reversals and generate buy or sell signals. Traders widely utilize this indicator for its effectiveness in capturing market trends.
Bollinger Bands, yet another potent indicator, facilitate the analysis of volatility and the identification of potential price breakouts or reversals. Bollinger Bands grant insights into market conditions and potential trading opportunities by plotting standard deviations around a moving average.
The Ichimoku Cloud, on the other hand, provides traders with a comprehensive view of support, resistance, and trend direction. This holistic indicator assists traders in identifying potential entry and exit points by considering the interplay of multiple components within the cloud.
On Balance Volume (OBV) merges volume and price analysis to evaluate buying and selling pressure in the market. It aids traders in gauging the strength of trends and confirming potential price reversals.
The Stochastic Oscillator, a momentum indicator, juxtaposes a cryptocurrency’s closing price with its price range over a specified period. It furnishes valuable insights into overbought and oversold conditions, enabling traders to make informed decisions.
The Average True Range (ATR) is a reliable indicator for assessing volatility. Measuring the average range between high and low prices grants traders an understanding of potential price movement and assists in establishing realistic stop-loss levels.
Fibonacci Retracement, derived from the Fibonacci sequence, aids traders in identifying possible levels of support and resistance. It guides traders in determining crucial price levels for entering or exiting positions.
Williams %R, a momentum indicator, signals overbought or oversold conditions. It offers traders valuable cues for potential trend reversals or continuations.
Lastly, Volume Weighted Average Price (VWAP) incorporates volume and price data to calculate a weighted average price. This indicator assists traders in assessing the fair value of an asset and identifying potential buy or sell zones.
You will possess a robust toolkit by integrating these top 10 indicators into your cryptocurrency trading strategy. However, it is essential to remember that indicators should be used in conjunction with other analysis forms and adapted to your individual trading style and risk tolerance.
So, equip yourself with these potent indicators, stay well-informed, and continuously refine your trading skills. The world of cryptocurrency trading is ever-evolving, and with the right tools, knowledge, and discipline, you can confidently navigate its exciting terrain.


