Quick Links
Looking to expand your knowledge about chart patterns? Look no further! Our comprehensive guide delves deeper into the importance of crypto chart patterns in trading.
Traders rely heavily on chart patterns to make informed decisions and identify market trends. As cryptocurrencies gain in popularity, understanding the most profitable chart patterns is vital to optimizing profits.
By the end of this guide, you’ll have a solid comprehension of the most profitable crypto chart patterns, empowering you to enhance your trading abilities. So let’s begin our exploration of the world of lucrative crypto chart patterns!
Understanding Crypto Chart Patterns
If you’re new to cryptocurrency trading, you may have come across the term “chart patterns” quite frequently. However, what do they mean, and how can they help you make the right trades?
To grasp the concept of chart patterns, it is crucial to familiarize yourself with the fundamentals of technical analysis. Technical analysis involves analyzing market data such as price and volume to identify trends and forecast future price movements. It is based on the notion that market data follows certain patterns that can be analyzed to make informed trading decisions.
Chart patterns constitute one of the primary tools used in technical analysis. They denote particular formations that appear on a price chart, suggesting a potential change in the price direction. These formations may range from simple to intricate, and traders use them to predict when to purchase or sell an asset.
So, what function do chart patterns serve in forecasting price movements? In simple terms, they offer traders a graphical representation of market sentiment. Whenever a specific pattern emerges on a chart, it implies that market participants are behaving in a particular way, such as buying or selling. By scrutinizing these patterns, traders can obtain insight into what other market participants are doing and use that knowledge to make profitable trades.
Numerous chart patterns exist, each with its distinctive characteristics and potential outcomes. Some examples of common patterns include triangles, head and shoulders, and double tops/bottoms. The ability to identify these patterns and understand their potential outcomes is essential for successful cryptocurrency trading.
Bullish Chart Patterns
Traders in the financial world often rely on bullish chart patterns, as they indicate an asset’s price is likely to increase soon. Herein, we’ll define bullish chart patterns and cover various examples of these patterns, discuss how to trade them and offer tips for identifying profitable ones.
In essence, bullish chart patterns are indicative of positive market sentiment, meaning a particular asset’s price is expected to rise. There are numerous examples of bullish chart patterns, including the ascending triangle, cup and handle pattern, and bullish flag. Each pattern possesses unique characteristics that help identify a bullish trend.
Trading bullish chart patterns necessitates patience and sound technical analysis knowledge. It’s essential to accurately identify the pattern and wait for the price to surpass the resistance level of the pattern. Once the price breaks out of the pattern, traders can place a buy order and set a stop loss to manage risk.
To identify profitable bullish chart patterns, traders should examine those that occur in higher time frames, indicating a strong trend. Moreover, patterns with high trading volume, pointing to a significant buying interest, are usually more lucrative.
Bearish Chart Patterns
If you consider charts while making your investment positions, bearish chart patterns are a vital aspect of trading decisions. We will try to delve into the intricacies of bearish chart patterns, including their definition, real-life examples, trading strategies, and tips for identifying profitable patterns.
Bearish chart patterns are technical signals that indicate an asset’s price is likely to fall. Examples of bearish chart patterns include the head and shoulders pattern, descending triangle, and bearish flag. These patterns help predict a downtrend, allowing traders to make sound decisions.
Trading bearish chart patterns involves identifying the pattern and waiting for the price to break below the support level. Once the price breaks out, traders can place a sell order and set a stop loss to manage risk. Successful traders use these patterns to maximize profits and minimize losses.
To spot profitable bearish chart patterns, traders should look for patterns that appear on higher time frames, indicating a strong downtrend. Additionally, traders should seek patterns with high trading volume, which shows a high selling interest.
Continuation Chart Patterns
Continuation chart patterns are critical indicators for technical analysis. We will explore what continuation chart patterns are, examples of them, trading strategies, and tips to identify profitable continuation chart patterns.
A continuation chart pattern is a technical indicator that signals a temporary pause in an asset’s price trend. These patterns suggest that the asset’s price will continue its previous trend once the pattern is completed. Flag patterns, pennant patterns, and wedge patterns are examples of continuation chart patterns.

To trade continuation chart patterns, traders identify the pattern, wait for the price to break out of the pattern, and then enter a trade in the direction of the previous trend. Traders usually place their stop-loss orders below the pattern’s support level.
To identify profitable continuation chart patterns, traders should look for patterns that occur after a strong price trend. Also, patterns with higher trading volume have a greater chance of being profitable.
Continuation chart patterns are essential indicators for traders to identify a temporary pause in an asset’s price trend and anticipate the asset’s next move. By understanding these patterns and applying technical analysis, traders can make informed trading decisions and achieve profitable trades. Keep ahead of the curve with continuation chart patterns.
Reversal Chart Patterns
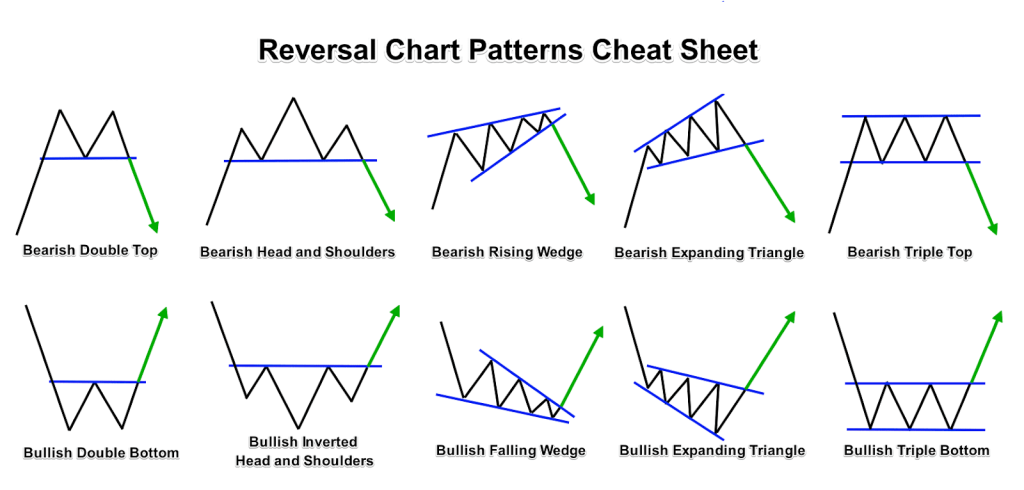
Here we’ll try to explore what reversal chart patterns are, different types of patterns, trading strategies, and tips for identifying profitable patterns.
Reversal chart patterns are technical indicators that suggest a trend reversal in an asset’s price. These patterns are identified based on price movements and chart formations. Some of the most common reversal chart patterns include head and shoulders, double tops and bottoms, and bullish and bearish engulfing patterns.

Trading reversal chart patterns involves identifying the pattern and waiting for confirmation that the trend has reversed. Traders can enter a trade once they see a confirmed reversal, such as a break above the pattern’s resistance level. A stop-loss order can also be placed to manage potential losses.
To identify profitable reversal chart patterns, traders should look for patterns that occur after a significant trend. Additionally, high trading volume can indicate strong market interest in the reversal, increasing the probability of a profitable trade.
Advanced Chart Pattern Trading Strategies
Let’s look into ways to capitalize on multiple chart patterns to increase your chances of success. Additionally, we’ll highlight the vital role of risk management and how to craft a profitable trading plan.
The ability to trade multiple patterns is one of the crucial elements of successful chart pattern trading. This can help you diversify your portfolio and create a potent trading strategy that can adapt to various market conditions. Merging various chart patterns like continuation patterns, reversal patterns, and others can enable you to attain great success.
Trading is not only about winning trades but also managing risk. Risk management is the cornerstone of ensuring that your trades do not deplete your account. Astute traders always have a risk management plan in place before making any trade. This includes setting stop-loss orders, establishing the maximum amount of risk they can take per trade, and sticking to their trading plan.
A profitable trading plan is indispensable to achieve consistent trading success. Your trading plan should include your trading strategy, risk management rules, and trading goals. This strategy will help you stay focused, minimize emotional decision-making, and maintain discipline during trades.
To create a profitable trading plan, you should start by identifying your trading style and the chart patterns that align with your strategy. Secondly, determine the capital you are willing to risk per trade and establish your risk management rules accordingly. Lastly, set realistic trading goals and track your progress to make sure you are headed in the right direction.
Technical Indicators and Chart Patterns
Let’s delve into the fundamental concepts of technical indicators and explore how you can be combined with chart patterns to make informed trading decisions. Additionally, we will examine some successful case studies to illustrate these concepts.
Technical indicators are mathematical calculations that rely on past price and volume data. These indicators provide traders with valuable insights into market trends, momentum, and price movements. Popular technical indicators include moving averages, relative strength index (RSI), and stochastic oscillators.
By combining technical indicators with chart patterns, traders can make more informed decisions. Chart patterns represent visual representations of price movements over time and can provide insights into market trends, support and resistance levels, and potential trading opportunities. By utilizing technical indicators in conjunction with chart patterns, traders can identify entry and exit points, confirm trends, and minimize risks.
One successful example of combining technical indicators and chart patterns is the use of the RSI indicator with the double bottom pattern. The double bottom pattern is a bullish reversal pattern that appears on a chart after a prolonged downtrend. It is characterized by two consecutive troughs that are roughly equal, followed by a breakout above the pattern’s resistance level. On the other hand, the RSI indicator measures the momentum of a stock and helps traders identify overbought or oversold conditions. When the RSI is oversold and the double bottom pattern appears, it can signal a potential buying opportunity.
Another successful combination is the use of the moving average convergence divergence (MACD) indicator with the head and shoulders pattern. The head and shoulders pattern is a bearish reversal pattern that appears on a chart after a prolonged uptrend. It is characterized by a peak (the head) between two smaller peaks (the shoulders). The MACD indicator helps traders identify trend changes and momentum shifts. When the MACD crosses below its signal line and the head and shoulders pattern appears, it can signal a potential selling opportunity.
Technical indicators and chart patterns can be powerful tools for traders when used effectively. They can help identify potential trading opportunities, confirm trends, and minimize risks. By studying successful combinations and experimenting with different strategies, traders can develop their unique approach to technical analysis and improve their chances of success.
Conclusion
To wrap up, we have covered a wide range of topics in this comprehensive guide on profitable crypto chart patterns for trading. Our journey started with the fundamentals of comprehending crypto chart patterns and advanced to investigating various chart pattern categories, such as bullish, bearish, continuation, and reversal patterns. Additionally, we examined advanced chart pattern trading strategies, including the role of technical indicators in chart pattern analysis.
In summary, chart patterns are an effective tool for traders to predict potential price movements based on market sentiment. By learning to identify these patterns and utilizing them to make informed trading decisions, traders can improve their chances of making profitable trades.
However, it’s crucial to note that chart patterns are not foolproof and should not be solely relied on for trading decisions. Instead, they should be used as a part of a trader’s toolkit and complemented with other analysis and risk management strategies.
To conclude, we encourage traders to continue exploring and experimenting with different chart patterns and trading strategies to identify what works best for their trading style and risk tolerance. With practice and perseverance, traders can unleash the complete potential of chart pattern analysis and succeed in the exhilarating world of crypto trading.


