Quick Links
Non-fungible tokens (NFTs) have popped out as a hot topic in the world of blockchain technology and Web3 space. In recent years, NFTs have gained mainstream attention due to high-volume sales of digital art and other unique digital assets. In the blog, we will explore the quantitative side of NFTs, analyzing market trends, price fluctuations, investor behaviour, and the impact of BLUR on NFT sales.
Market Trends
The NFT market has experienced explosive growth in recent years, with sales increasing from less than $1.6 Bn in Q3 2022 to over $3.2 Bn in the first quarter of 2023 The reason for this growth can be explained by a combination of factors, including the increasing popularity of NFTs, the expansion blockchain technology, and the launch of new marketplaces and platforms facilitate the buying and selling of NFTs.
Going through the data represented in the above charts for 2022-23, One notable trend in the NFT market is the dominance of the utility category along with the Gaming and collectables category. According to data from NonFungible.com, collectables’ NFT sales accounted for over 70% of the total NFT market volume in 2022, with the remainder being made up of categories such as gaming, sports, and collectables.
Within the Collectibles category, CrytoPunks and Bored Apes are the most popular type of NFT. The collectables are usually related to some community or represent something exclusive and rare, like a video NFT of a former US president or NFT of the first-ever tweet.
Key takeaways of “what consumers want” – a report from Dappradar
- Despite a 60% YoY drop in ETH, the on-chain NFT trading volume in 2022 remained almost unchanged from 2021 at $24.7 billion, demonstrating the industry’s resilience. The total NFT sales count in 2022 increased 67% to 107 million, with marketplace-based sales accounting for 68.35 million transactions.
- 92% of respondents see an advantage in having NFTs that can provide them with benefits; 61% mentioned one of the two most important considerations (33% most important) when choosing an NFT.
- There are two main gaps in the NFT market: one is the information gap and the second is the access gap, with consumers needing easier access to the market and the ability to purchase NFTs without the requirement to use cryptocurrency and at a relatively low price.
- 52% of survey respondents say that the ability to purchase NFTs with a credit card is one of the two most important aspects (30% most important) when acquiring NFTs.
- Web2 companies moving towards NFTs is an important trend, with over 100 tier-one brands already offering NFTs to their consumers today, as they seek to create unique and valuable experiences for their consumers.
If we see the all-time stats on different NFT marketplaces, we can easily see that marketplaces like LooksRare, X2Y2, Element & Liquidity have very high ( >50%) of the trades being wash trades volumes. Whereas marketplaces like BLUR and Opensea have lower occurrences of wash trades and higher numbers of organic trades volume.
Using the same All-time trades dataset for NFT marketplaces, we can see that out of 37.6Mn NFT trades, nearly 37.05 Mn were organic trades while 550k were wash trades.
Price Fluctuations
The prices of NFTs can vary greatly, with some being sold for millions of dollars and others selling for just a few dollars. When it comes to the price of an NFT it depends on various factors like the rarity of the asset, the reputation of the creator, and the demand from buyers or the Hype around it.
If we take a look at the chart below, we can see the difference in the average price an NFT is sold for, and excluding the outliers, one can say that an NFT is sold for $300 on average across different platforms.
Investor Behavior
Investors in the NFT market can be differentiated into two groups: collectors and speculators. Collectors purchase NFTs primarily for their own enjoyment or as a means of supporting their favorite artists. Speculators, on the other hand, are investors who purchase NFTs with the hope of making a profit on their investment.
Unlike traditional financial markets, where investors base their decisions on fundamental analysis and technical analysis, NFT investors are often motivated by more subjective factors such as personal taste and brand recognition.
For example, some NFT investors may be willing to pay a premium for an NFT created by a well-known artist or a celebrity, even if the asset itself has little intrinsic value. This behaviour can lead to significant price disparities between similar NFTs, depending on the reputation of the creator.
Another interesting pattern in NFT investor behavior is the prevalence of hype cycles. Hype cycles occur when a particular NFT or artist see a surge in popularity, leading to a quick increase in price. These hype cycles can be driven by a variety of factors like social media buzz, media coverage, and celebrity endorsements.
However, hype cycles can also lead to market distortion. This has been the case with so many NFT collections that have just ridden the hype cycle and reached price speculation above any other NFT collection.
WashTrading
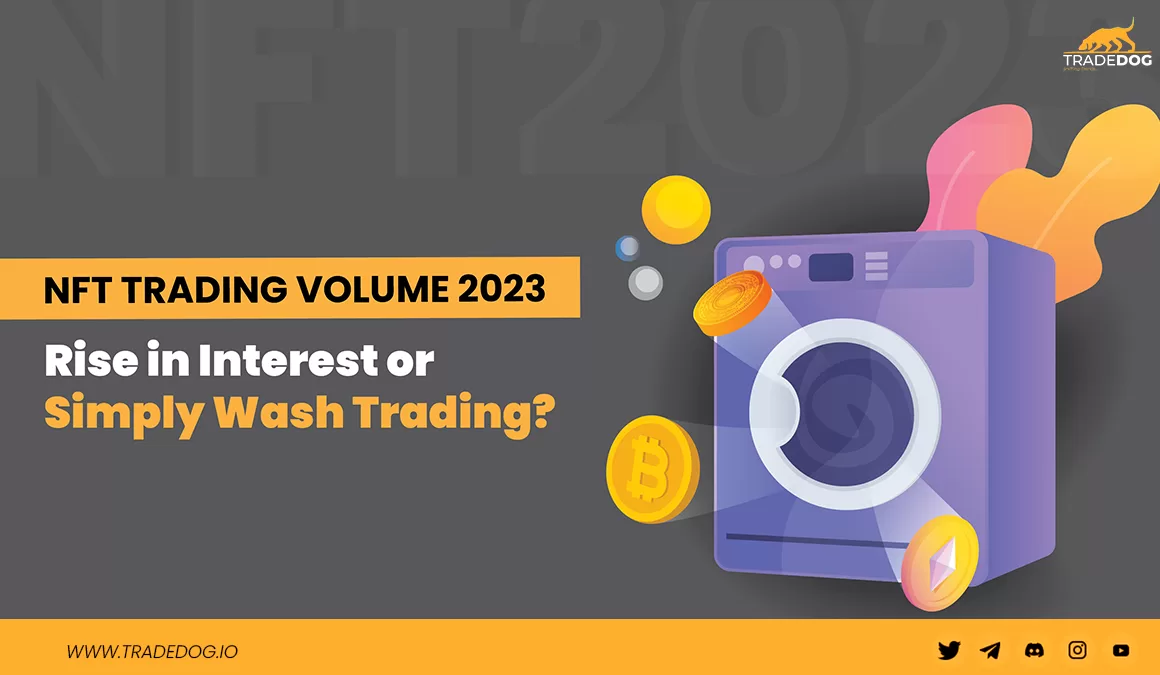
NFT wash trades are a type of fraudulent activity in which an individual or group artificially inflates the value of a non-fungible token (NFT) by creating fake trades. These trades involve the same NFT being bought and sold between two or more parties, with no actual change in ownership or transfer of value.
Identifying NFT wash trades can be a challenge, but there are a few signs that can help in identifying these activities:
- Repeated trades of the same NFT: If you see the same NFT being bought and sold multiple times in a short period of time, this could be a sign of wash trading.
- Unusually high trading volumes: If the trading volume for a particular NFT suddenly increases dramatically, this could be a sign of wash trading.
- Suspicious trading patterns: If you notice that trades are happening at regular intervals or at round numbers, this could be a sign of wash trading.
- Lack of diversity in trading partners: If the same individuals or groups are buying and selling the NFT repeatedly, this could be a sign of wash trading.
It is important to understand that not all instances of repeated trades or high trading volumes necessarily indicate wash trading. However, if you notice several of these signs occurring together, it may be worth investigating further to determine if fraudulent activity is taking place.
| All-time Washtrading Stats | ||||||
| Marketplace | Total Volume | Organic Volume | Wash Volume | Total Trades | Organic Trades | Wash Trades |
| OpenSea | $33,104,607,265 | $32,328,035,304 | $776,571,961 | 28,139,458 | 27,939,422 | 200,036 |
| Blur | $2,952,214,421 | $2,511,131,228 | $441,083,193 | 2,939,272 | 2,864,022 | 75,250 |
| CryptoPunks | $2,508,537,129 | $2,476,756,711 | $31,780,418 | 22,563 | 22,168 | 395 |
| Gem | $1,557,294,144 | $1,462,732,855 | $94,561,289 | 3,843,106 | 3,797,709 | 45,397 |
| LooksRare | $27,601,369,733 | $1,454,712,475 | $26,146,657,258 | 266,295 | 235,804 | 30,491 |
| X2Y2 | $4,265,995,385 | $629,365,393 | $3,636,629,992 | 594,484 | 467,300 | 127,184 |
| Genie | $512,208,227 | $506,901,016 | $5,307,211 | 755,609 | 750,600 | 5,009 |
| SuperRare | $292,634,333 | $290,726,046 | $1,908,287 | 37,795 | 37,466 | 329 |
| Foundation | $208,667,267 | $206,575,153 | $2,092,114 | 131,429 | 128,960 | 2,469 |
| Sudoswap | $75,527,716 | $67,181,277 | $8,346,439 | 243,358 | 207,493 | 35,865 |
| Reservoir | $45,142,087 | $44,976,201 | $165,886 | 185,624 | 185,269 | 355 |
| Element | $94,350,143 | $34,770,634 | $59,579,509 | 180,491 | 149,577 | 30,914 |
| Zora | $32,443,382 | $31,614,052 | $829,330 | 13,542 | 12,566 | 976 |
| Alpha Sharks | $20,145,232 | $20,061,484 | $83,748 | 183,483 | 182,982 | 501 |
| Uniswap | $7,674,386 | $7,587,483 | $86,903 | 31,845 | 31,591 | 254 |
| Archipelago | $5,374,013 | $5,361,764 | $12,249 | 561 | 480 | 81 |
| Rarible | $4,177,502 | $3,967,398 | $210,104 | 13,062 | 13,003 | 59 |
| OKX | $3,258,502 | $3,044,507 | $213,995 | 18,522 | 18,295 | 227 |
| BitKeep | $1,114,924 | $971,210 | $143,714 | 4,238 | 3,793 | 445 |
| Flip | $410,248 | $410,248 | $0 | 1,220 | 1,220 | 0 |
| Magic Eden | $333,915 | $333,698 | $217 | 2,050 | 2,035 | 15 |
| Tiny Astro | $102,220 | $101,426 | $794 | 2,980 | 2,947 | 33 |
| Trove | $74,344 | $74,284 | $60 | 502 | 501 | 1 |
| Skillet | $70,348 | $58,318 | $12,030 | 39 | 36 | 3 |
| Rarity Garden | $29,082 | $29,082 | $0 | 1,787 | 1,787 | 0 |
| GigaMart | $27,797 | $27,780 | $17 | 148 | 147 | 1 |
| NFTInit | $16,187 | $16,187 | $0 | 61 | 61 | 0 |
| Liquidifty | $5,779 | $10 | $5,769 | 58 | 3 | 55 |
Impact of BLUR NFT Marketplace
The launch of the Blur marketplace had an deep impact on the NFT market. Blur introduced several features that differentiated it from other NFT marketplaces, such as allowing creators to upload and sell unlimited NFTs for free, providing a flexible royalty system, and implementing a decentralized storage system. These features made the platform more appealing to both creators and collectors and contributed to its growth in popularity.
As more creators began to use Blur, it created a more competitive landscape for NFT marketplaces, which resulted in other platforms adopting similar features and improving their services to remain relevant. For example, some NFT marketplaces started offering lower fees, more flexible royalty systems, and improved storage solutions to compete with Blur. The sales volume crossed $2 Bn in February, thanks to BLUR driving the growth.
Overall, the launch of Blur has had a positive impact on the NFT market by promoting innovation and competition and providing more opportunities for creators to monetize their work.
| Users on Blur | |
| Category | Amount |
| Past OpenSea User | 77961 |
| New NFT Trader | 27766 |
| Others | 15043 |
| Past Gem User | 3676 |
Blur AirDrop Details
Blur offered up 360 million BLUR tokens through the airdrop
Before $BLUR token launch, there are 3 Airdrop rounds:
- Airdrop 1 was for everyone who traded in the 6 months prior to the launch of the Blur marketplace.
- Airdrop 2 was for traders who actively listed on Blur through November.
- Airdrop 3 is for traders who place bids on Blur and will be the largest Blur airdrop (around 1-2x the size of Airdrop 2).
If a collection did a volume on BLUR (& other marketplaces), its creators are also qualified for Genesis Airdrop.
There has been a major debate on whether the Airdrop by BLUR is facilitating wash trades or just whales doing their bit of pump and dump. CryptoSlam, one of the platforms providing details on NFTs, has flagged BLUR for wash trading and removing $577 Mn of Blur volumes, as they want to present cleaner data and the actual landscape of the NFT market while other users who build their own hypothesis to flag wash trades have signaled BLUR to be having over 75% volume as organic trades.
Conclusion
In 2022, the NFT market saw significant growth, with the total value of NFT transactions reaching over $10 billion. This growth was largely driven by the popularity of NFTs in the art world, with high-profile sales of digital creations and collectibles.
Looking ahead to 2023, it is likely that the NFT market will continue to grow, but at a more sustainable pace. While there may still be some high-profile sales and record-breaking prices, the market will likely become more diverse, with NFTs being used in a wider range of industries and applications.
One potential area of growth for NFTs is the gaming industry. NFTs are being used to represent in-game items or assets, providing players with proof of ownership and allowing them to buy, sell, and trade these items on secondary markets.
Another area of potential growth is in the sports industry, where NFTs could be used to represent collectible items such as game-used equipment or trading cards. This could provide a new revenue stream for sports teams and players, as well as a new way for fans to engage with their favorite teams and players.
| Name | NFT Collection | Floor Price (ETH) | Volume in USD | Date of creation | Owners | Total Supply | 30D Sales | 7D volume |
| Uniwhale.co | Uniwhale Genesis Pass | 0.1021 | $95,916.40 | Feb 2023 | 2413 | 10000 | 1152 | 44027.2 |
| WumboLabs | WumboPass | 1.49 | $717,014.40 | Aug 2022 | 315 | 332 | 56 | 11242.66 |
| Coniun.io | Coniun Pass | 0.28 | $8,583,731.60 | Mar 2022 | 2811 | 6303 | 380 | 64468.4 |
| Mintech | Mintech | 0.35 | $226,425.60 | Aug 2022 | 294 | 300 | 29 | 3144.8 |
| FenixLabs | FenixLabs Lifetime Access pass | 0.06 | $459,140.80 | May 2022 | 511 | 682 | 38 | 1572.4 |
One more sector is Defi, where the NFTs are used as membership passes offering exclusive benefits like lower trading fees and free advisory and other services like asset management. The NFTs represent your holdings and membership tier. Many projects like Coniun, Wumbolabs, etc have launched their NFTs and sold their passes raising $8.5Mn & $701K respectively.
If we consider the average cost of minting an NFT from $50 – $ 150 and the average selling price currently is around $300, one can definitely think about launching NFTs to generate some good returns.
Overall, the NFT market is likely to continue to evolve and grow in 2023, with new use cases and applications emerging. While there may still be some volatility and uncertainty, the underlying technology and potential of NFTs are likely to drive continued growth and innovation in the years to come.

